所属先でRの勉強会(RClub)をするので,準備中。 役に立つか分からないけど *norm() 関数のイメージ図を作った。少し覚えやすくなるのではないか。
rnorm(), dnorm(), pnorm(), qnorm() の関係
コードはきれいではないけどとりあえず。
set.seed(100)
xaxpos <- - 0.001
xaxmin <- -4.5
xaxmax <- 4.5

X = 1.2
x <- seq(-4, 4, by = 0.05)

# rnorm

plot(NULL, axes = FALSE, xlab = "", ylab = "", xlim = range(x), ylim = c(-0.02, dnorm(0)), lwd = 2)
curve(dnorm, from = min(x), to = max(x), lwd = 2, add = TRUE)
arrows(xaxmin, xaxpos, xaxmax, xaxpos, xpd = TRUE, lwd = 2, length = 0.1)
rs = rnorm(50)
for (r in rs) {
  segments(r, xaxpos - 0.01, r, xaxpos + 0.01)
}
text(0, 0.1, "rnorm(n)", pos = 1, cex = 1.4)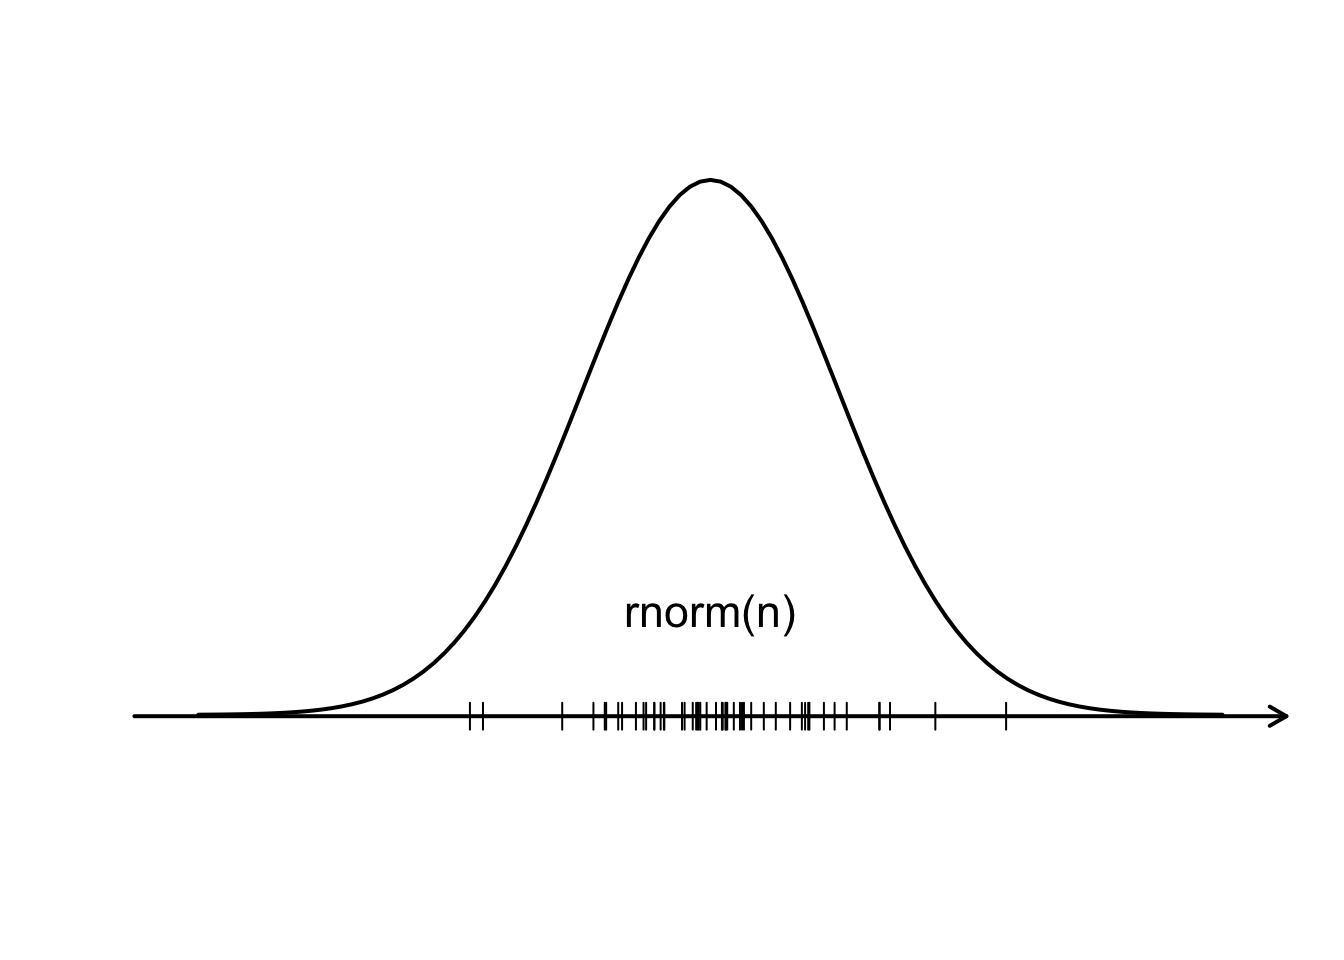
# dnorm

plot(NULL, axes = FALSE, xlab = "", ylab = "", xlim = range(x), ylim = c(-0.02, dnorm(0)), lwd = 2)
curve(dnorm, from = min(x), to = max(x), lwd = 2, add = TRUE)
arrows(xaxmin, xaxpos, xaxmax, xaxpos, xpd = TRUE, lwd = 2, length = 0.1)
segments(X, 0, X, dnorm(X))
segments(X - 0.1, dnorm(X), X + 0.3, dnorm(X))
text(X, -0.02, "x", cex = 1.4)
text(X + 0.3, dnorm(X), "dnorm(x)", pos = 4, cex = 1.4)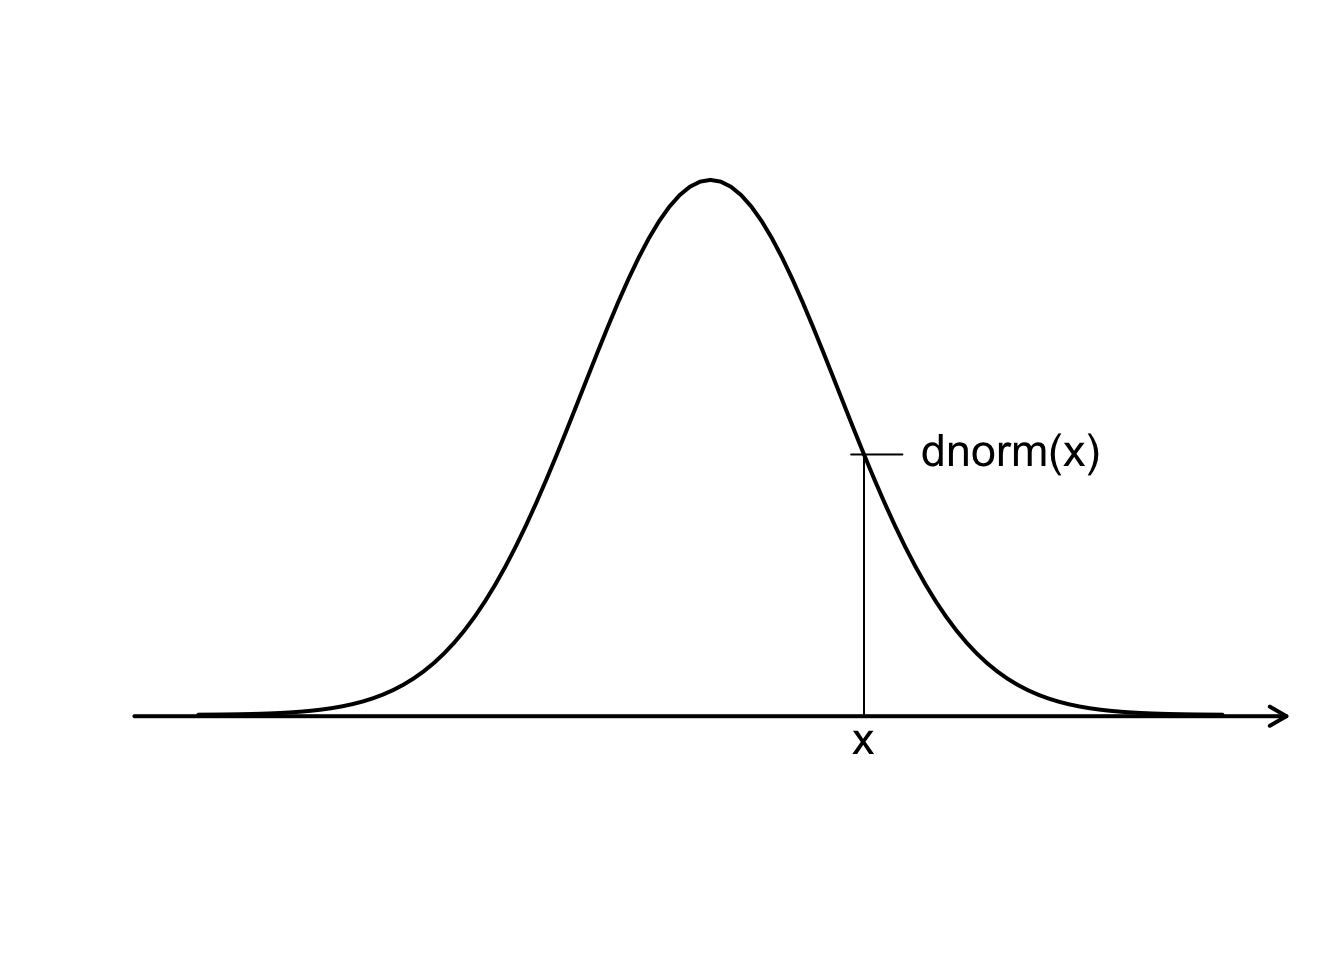
# pnorm

plot(NULL, axes = FALSE, xlab = "", ylab = "", xlim = c(-4, 4), ylim = c(-0.02, dnorm(0)), lwd = 2)
polygon(c(x[x < X], X), c(dnorm(x[x < X]), 0), col = rgb(1, 0, 0, 0.2), lty = 0)
curve(dnorm, from = - 4, to = 4, lwd = 2, add = TRUE)
arrows(xaxmin, xaxpos, xaxmax, xaxpos, xpd = TRUE, lwd = 2, length = 0.1)
text(X, -0.02, "q", cex = 1.4)
text(0, 0.8 * dnorm(X), "pnorm(q)", pos = 3, cex = 1.4)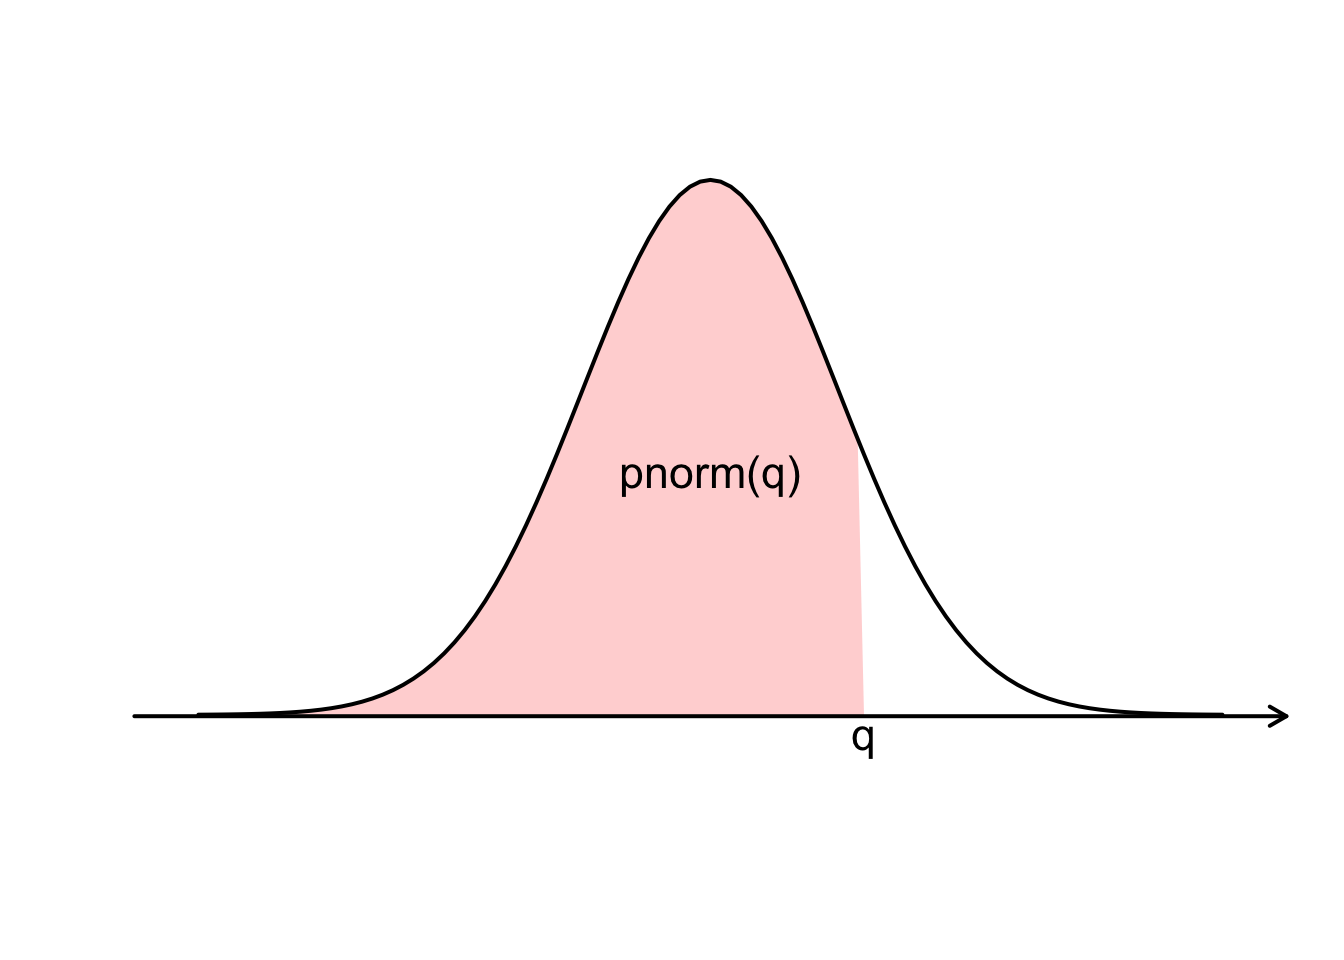
# qnorm

plot(NULL, axes = FALSE, xlab = "", ylab = "", xlim = c(-4, 4), ylim = c(-0.02, dnorm(0)), lwd = 2)
polygon(c(x[x < X], X), c(dnorm(x[x < X]), 0), col = rgb(1, 0, 0, 0.2), lty = 0)
curve(dnorm, from = - 4, to = 4, lwd = 2, add = TRUE)
arrows(xaxmin, xaxpos, xaxmax, xaxpos, xpd = TRUE, lwd = 2, length = 0.1)
text(X, -0.02, "qnorm(p)", cex = 1.4)
text(0, 0.8 * dnorm(X), "p", pos = 3, cex = 1.4)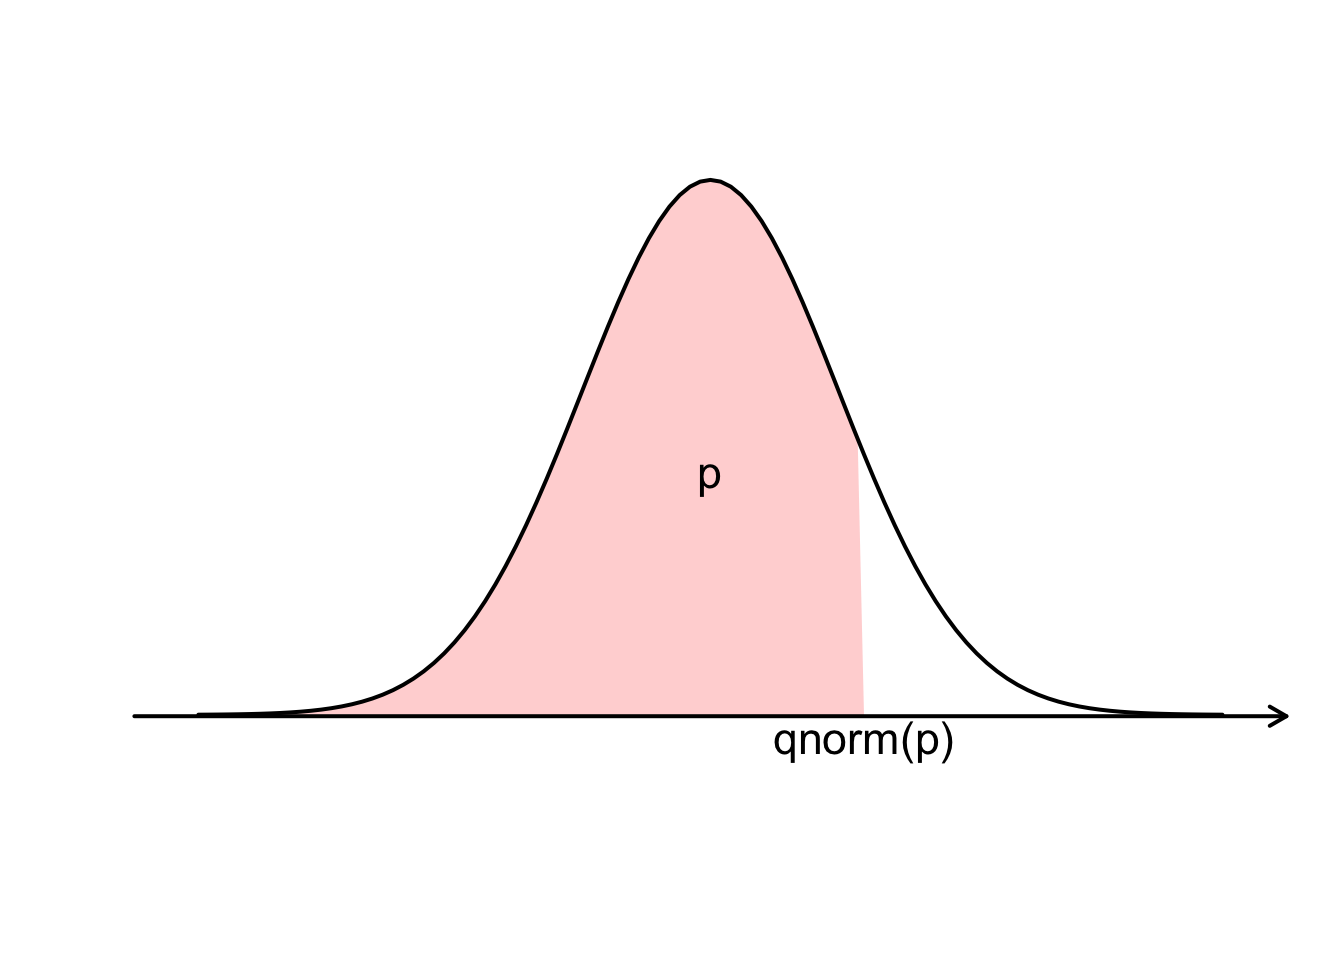
# complement

plot(NULL, axes = FALSE, xlab = "", ylab = "", xlim = c(-4, 4), ylim = c(-0.02, dnorm(0)), lwd = 2)
polygon(c(x[x > X], X), c(dnorm(x[x > X]), 0), col = rgb(1, 0, 0, 0.2), lty = 0)
curve(dnorm, from = - 4, to = 4, lwd = 2, add = TRUE)
arrows(xaxmin, xaxpos, xaxmax, xaxpos, xpd = TRUE, lwd = 2, length = 0.1)
text(X, -0.02, "q", cex = 1.4)
text(0.2, 0.06, "1-pnorm(q)", pos = 3, cex = 1.4)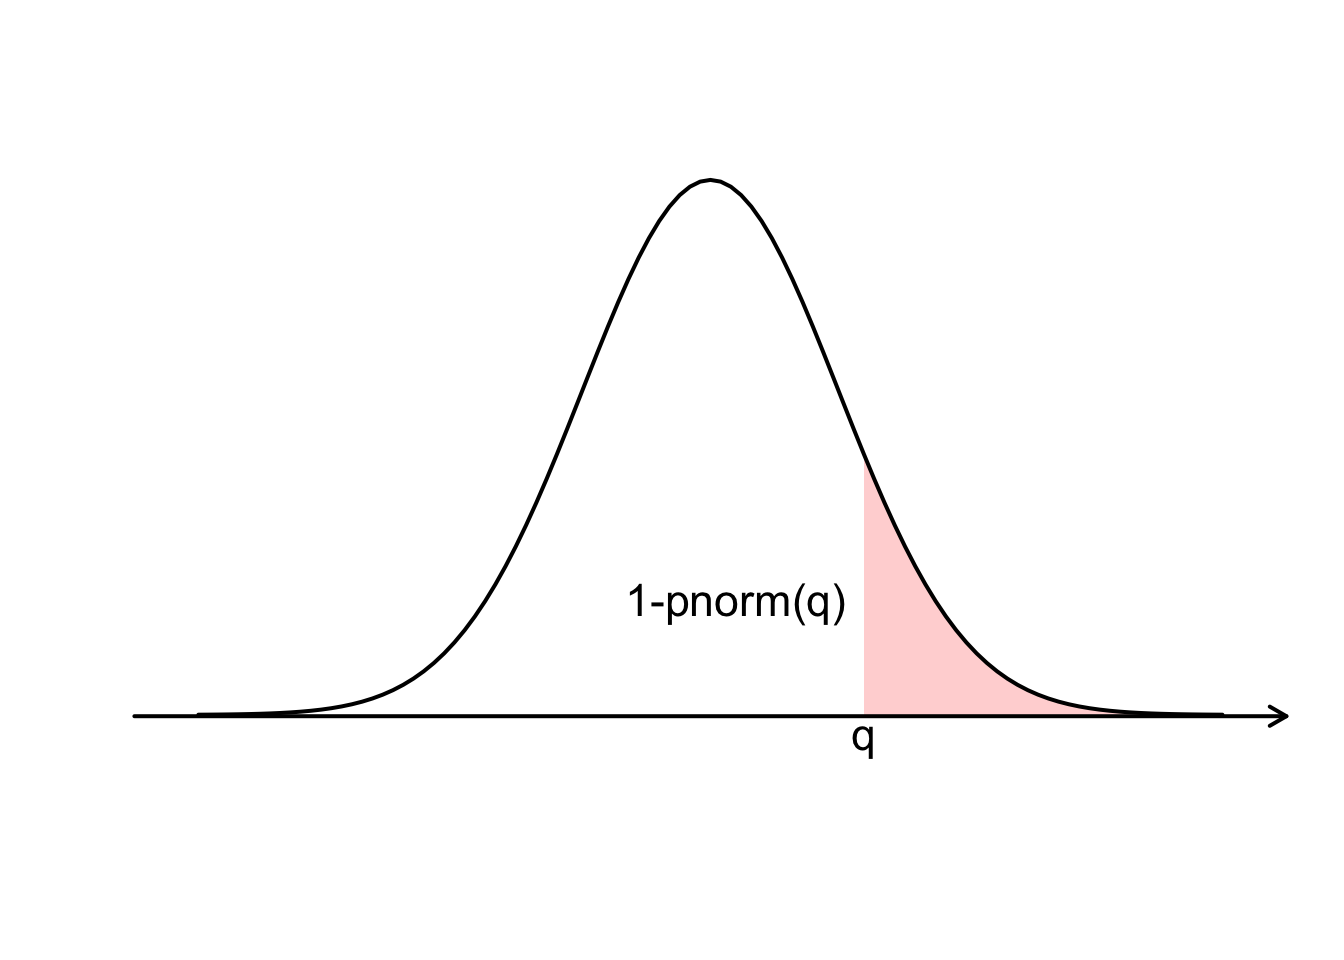
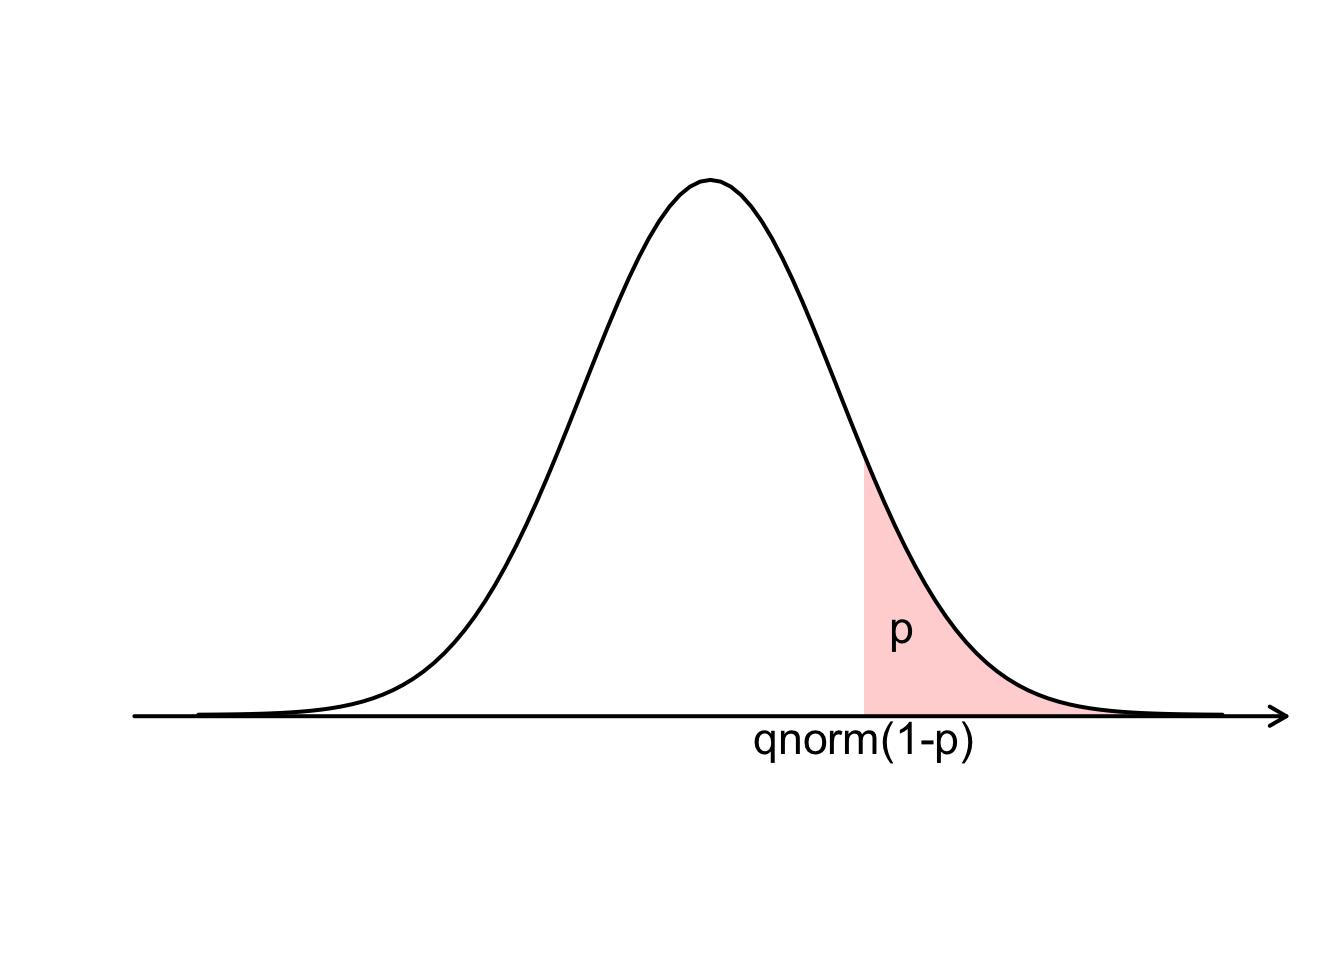
# complement

plot(NULL, axes = FALSE, xlab = "", ylab = "", xlim = c(-4, 4), ylim = c(-0.02, dnorm(0)), lwd = 2)
polygon(c(x[x > X], X), c(dnorm(x[x > X]), 0), col = rgb(1, 0, 0, 0.2), lty = 0)
curve(dnorm, from = - 4, to = 4, lwd = 2, add = TRUE)
arrows(xaxmin, xaxpos, xaxmax, xaxpos, xpd = TRUE, lwd = 2, length = 0.1)
text(X, -0.02, "qnorm(1-p)", cex = 1.4)
text(X + 0.3, 0.04, "p", pos = 3, cex = 1.4)